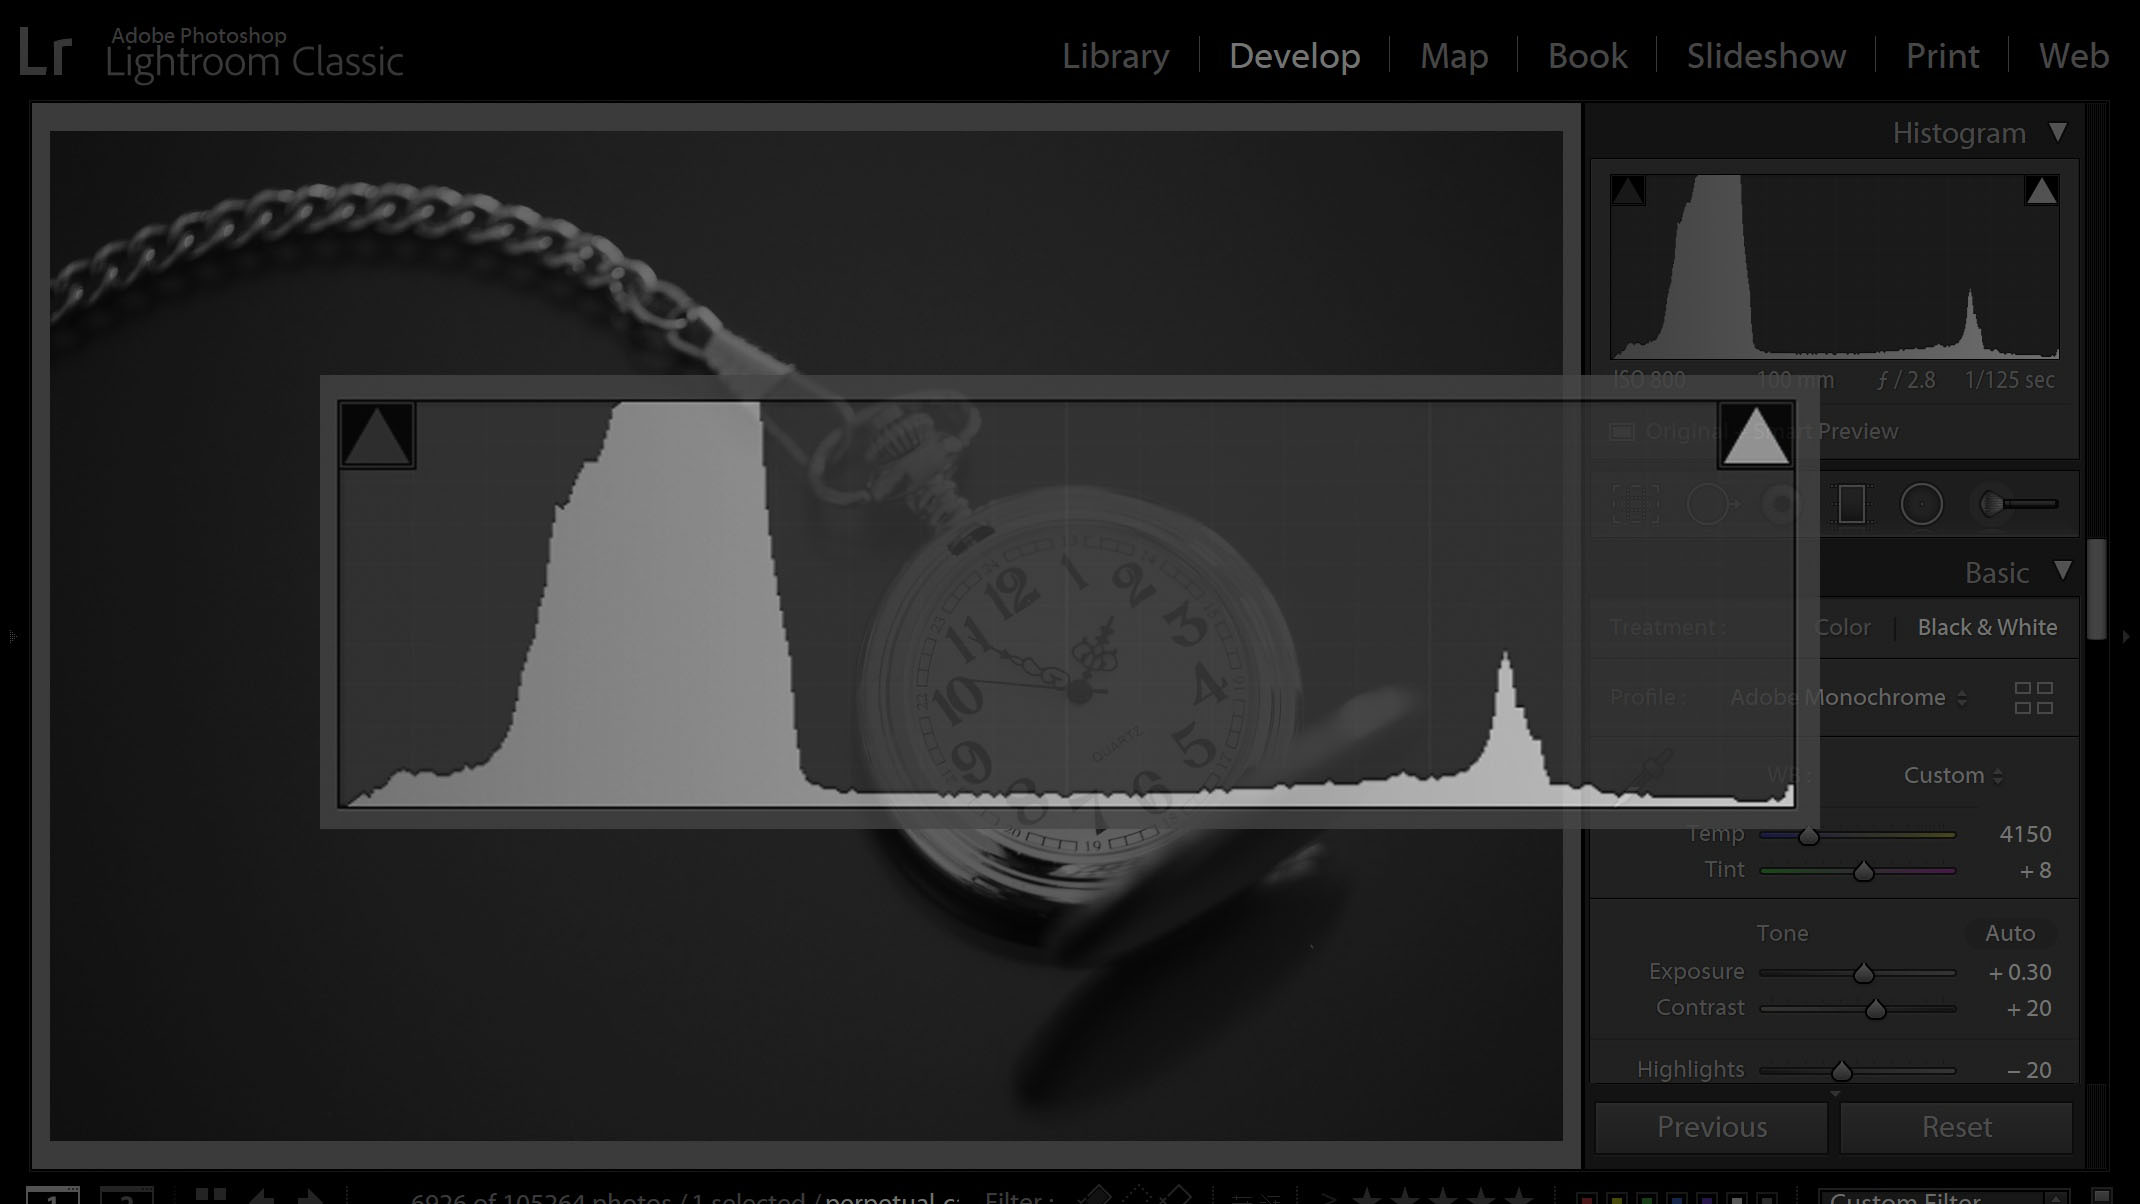
What is a histogram? For photographers of all types, understanding your histogram is a crucial aspect of getting the best image quality from your camera. If you don’t understand histograms, you’re going to be frustrated when your images turn out too bright or too dark, or just don’t seem to have a good level of contrast and detail.
However, if you do understand a histogram, you can easily create beautiful images that take full advantage of your camera’s image sensor! You’ll be able to expand your creative potential to include the most difficult lighting conditions, without being afraid of pictures turning out unexpectedly bad.
In this article, we’ll explain how to “read” or understand a histogram, and how to use it both in the field and in Lightroom, so that you can choose the right exposure and produce the best image quality.
How To Read A Histogram
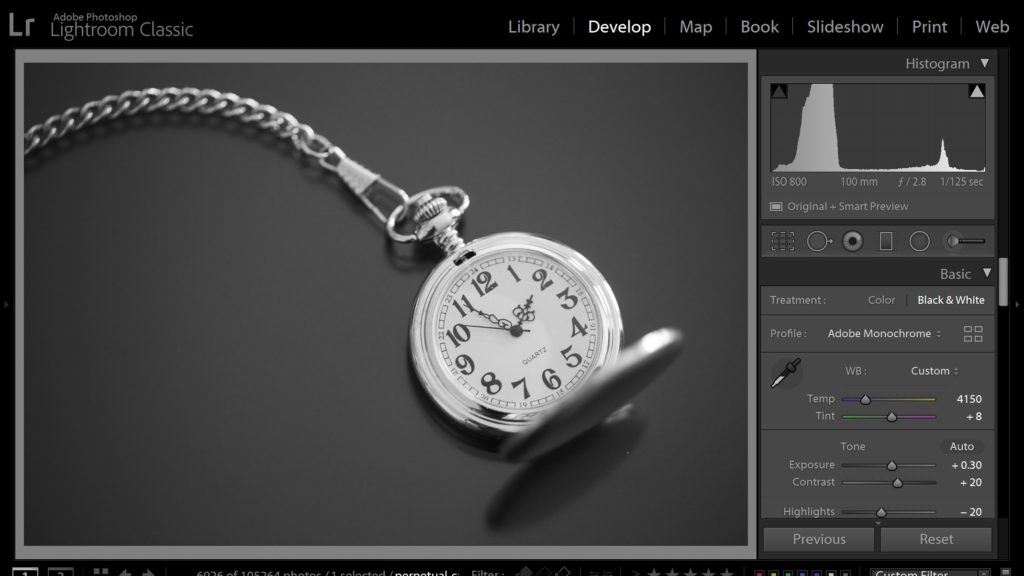
At first glance, a histogram may appear to be a very technical, un-creative thing that you’d try to avoid, especially as an artistic, creative person. But, to be a competent, skilled digital photographer, it’s very important to at least have a basic understanding of what you’re looking at.
Don’t worry, it’s quite simple! Once you realize what you’re looking at, it will become second-nature in no time.
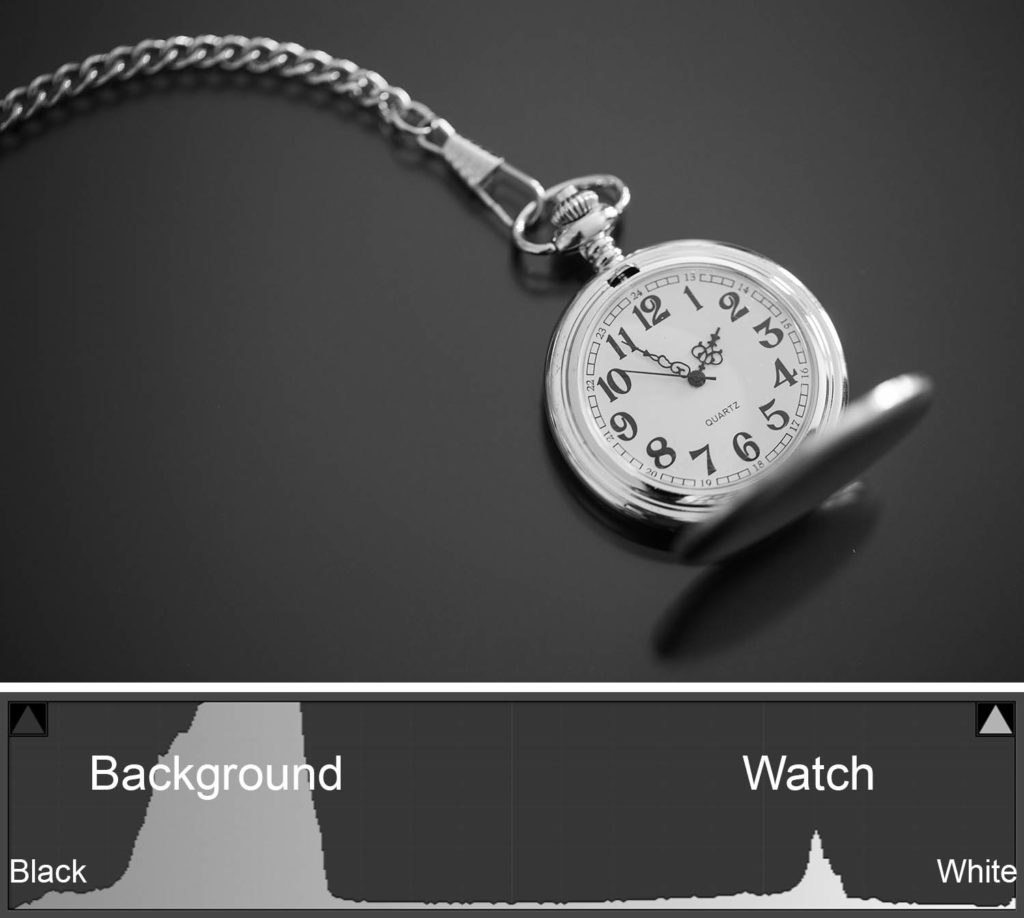
Here is all that technical stuff, in a nutshell: A histogram is a graph of your image data. From left to right, it charts your image’s tones from black to white. A “spike” or bump on the graph means that a significant part of your image has tone in that range.
So, if there is a spike or bump on the histogram’s left side, that means there are a lot of shadows. If there’s a bump on the right side, that means there are a lot of highlights.
That’s basically it! The best way to learn more and expand on this basic understanding is to just look at a bunch of your own images, and see if you can recognize the various bumps of the histogram, and which parts of your image they correspond to.
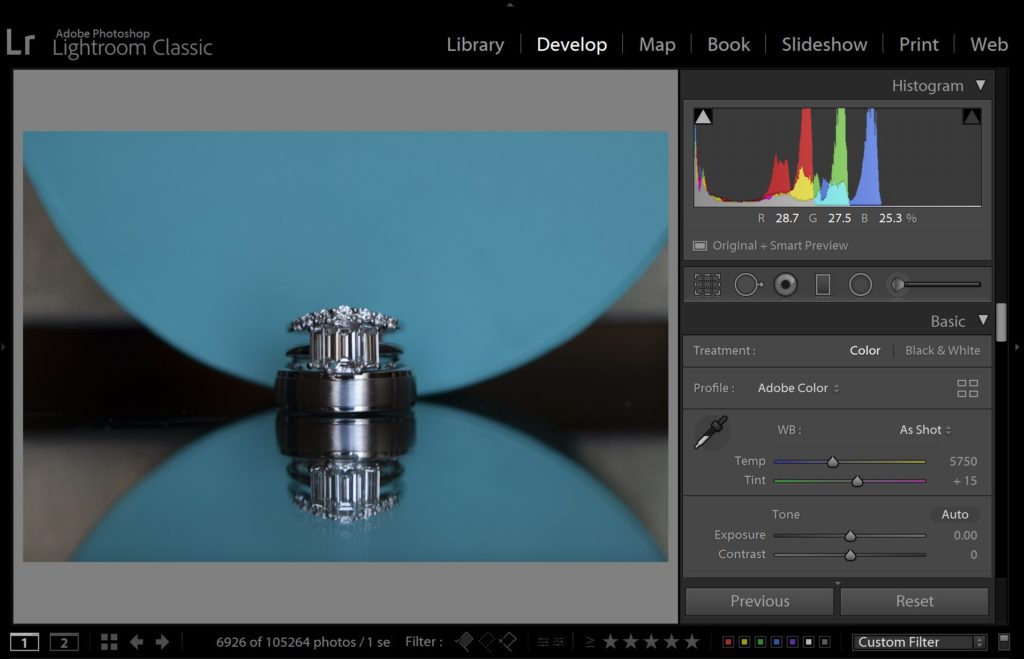
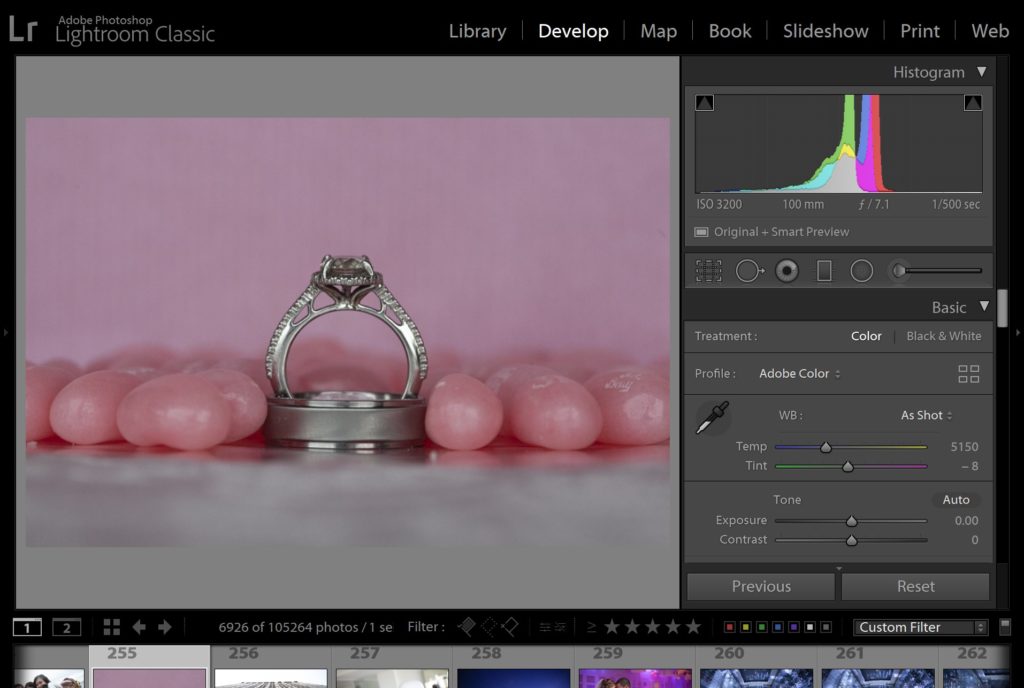
Of course, if you’re ready to dive in deeper, and understand more about the technical aspects of histograms, you can start looking at RGB histograms, and apply the same understanding of light and dark tones, to light and dark colors.
Why Is A Raw Histogram Different In Camera Versus In Lightroom?
Before we go any further, we must get through some bad news: The histogram you see on the back of your camera is not going to be identical to the histogram you see in Lightroom.
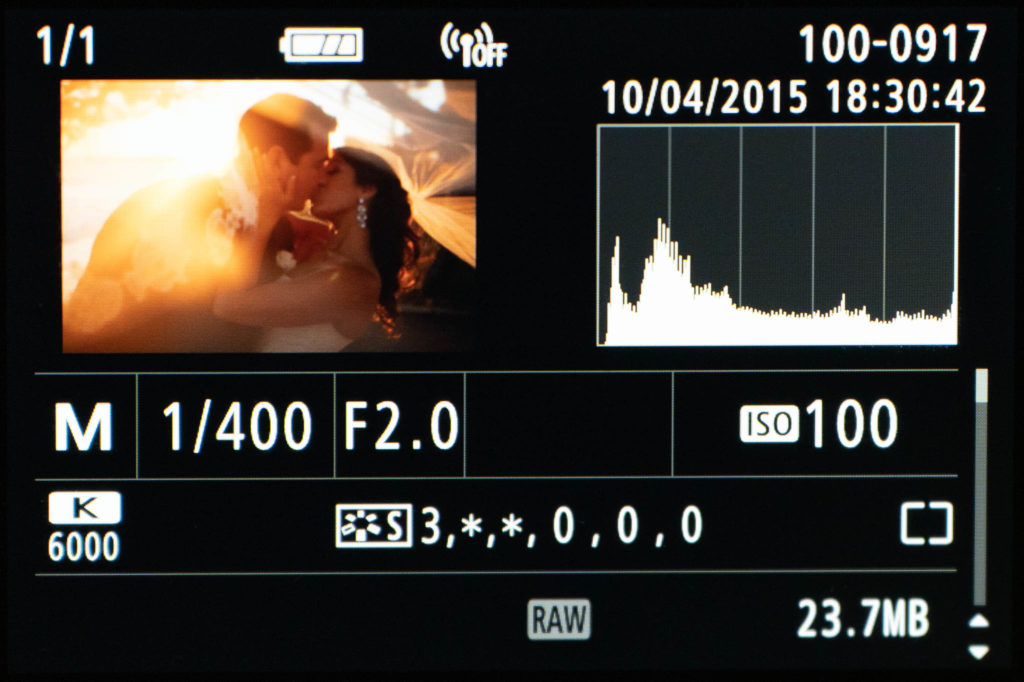
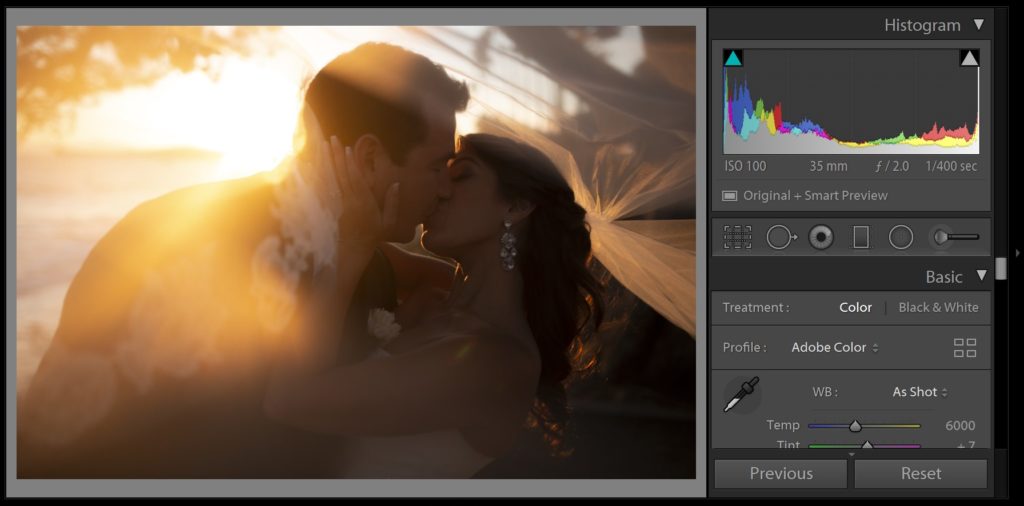
Why? This is because your camera is actually showing you a histogram based on a JPG image that is processed in-camera to represent the raw file. Yes, even if you shoot RAW and not RAW+JPG, you are still seeing a histogram from a JPG thumbnail of that raw file.
Lightroom, on the other hand, is showing you a histogram based on its own interpretation of that raw data. It’s still not directly a histogram of the raw data itself, but a representation of the processing you have applied to that raw data.
This is why it is very common for your images themselves to look very beautiful, vibrant, and contrasty on the back of the camera, and yet appear noticeably more dull and dark in Lightroom. Every raw image’s histogram will reflect this difference, too.
If this bothers you, you can try to minimize the difference by adjusting your in-camera processing to look more similar to how the raw file will appear in Lightroom. Look for your camera’s image processing settings – they’ll be called “Picture Style,” “Picture Control,” or “Creative Style.” Changing these settings won’t affect the actual raw image data, just the back-of-the-camera preview and its histogram.
Try switching this setting from “Standard” to “Neutral/Natural,” for a slightly more un-processed look. There is also a “Contrast” slider within those style control settings, and you can turn that down too for even flatter, more neutral looking images.
Just remember that if you do shoot JPG, or if you shoot any video, these settings WILL be applied to those files!
How To Use A Histogram To Get Better Photos
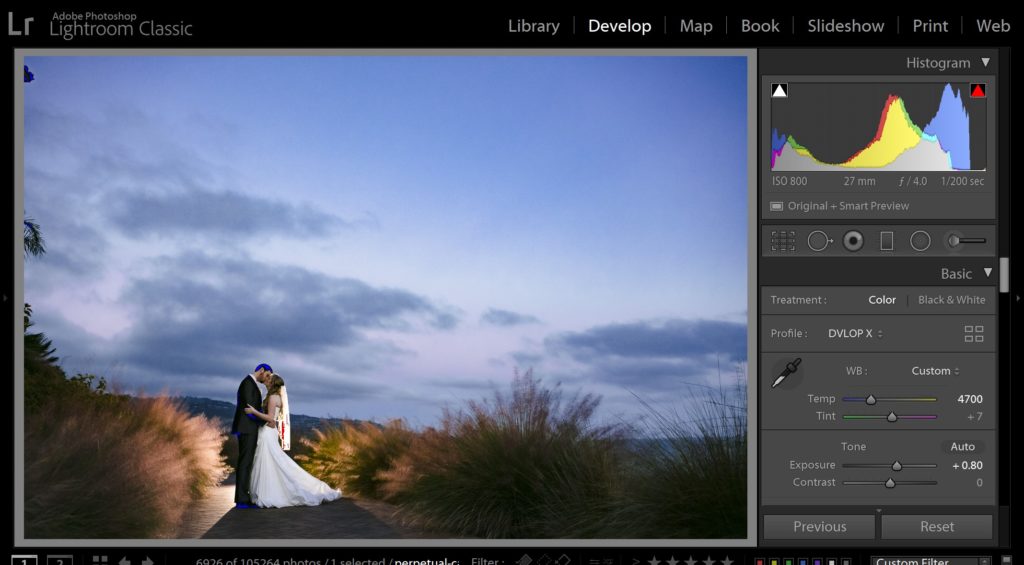
Okay, so, now that we fully understand histograms, how do we use this information to get better photos? It’s really quite simple: Avoid the edges of your histogram, especially with an important subject! If the image data graph touches the edges of the histogram, that means you may start to lose image data.
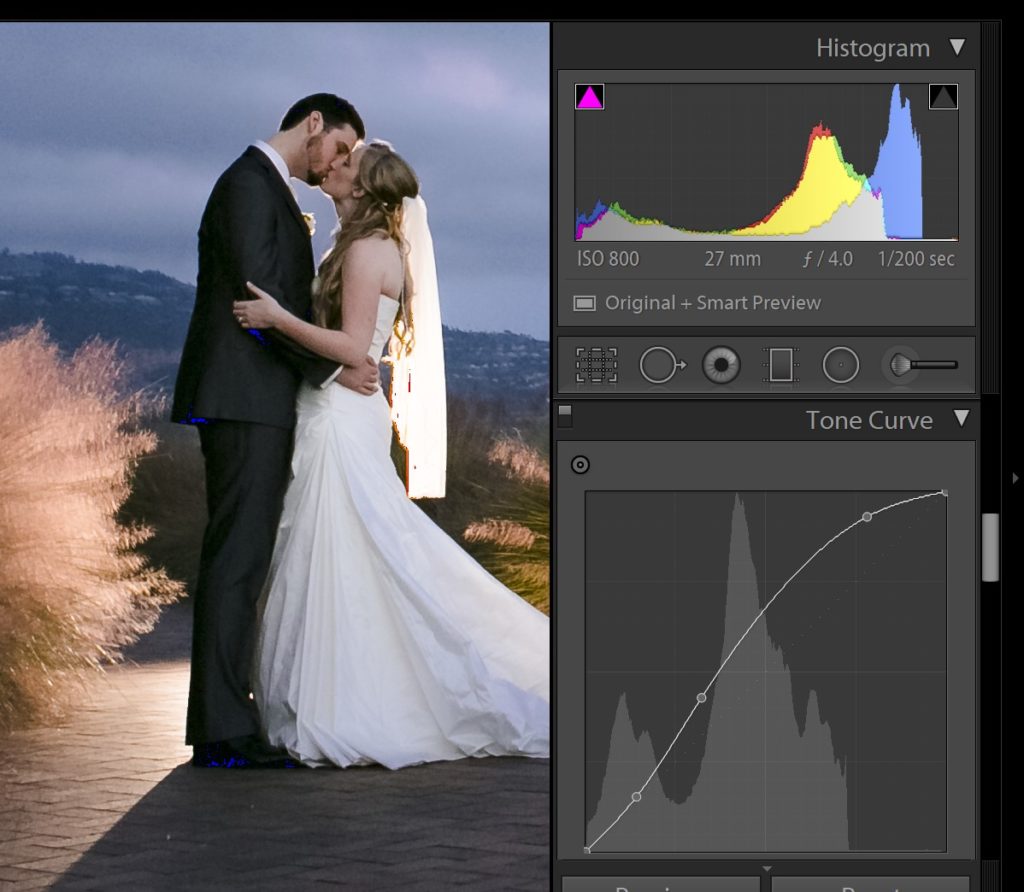
Of course, you want to correctly expose your subject, whether it’s a light-toned or dark-toned subject, or whether your ultimate goal is a high-key (bright) or low-key (dark) image, you already know what looks good to your eye. Just use your histogram as an aide in determining which highlights and/or shadows might be at risk of being “clipped,” or lost.
It may be easy for you to correctly expose most of your subject, but what about high-contrast scenes, with both highlights and shadows? That is where your histogram will come in handy the most…
Preserving Highlights With A Histogram
Using your histogram, you can “save” your highlights by making sure that the graph doesn’t slam into the RIGHT edge of your histogram. If all the highlights in your image are important to you, then you want the histogram data to just barely approach or touch the right edge. If you see it hit the edge, and especially if you see it begin to spike at that edge, then your exposure is too bright, and you need to darken it a little bit.
Preserving Shadows With A Histogram
The same technique applies to your shadows: You can save your shadows by choosing an exposure that doesn’t slam the histogram data against the LEFT edge. Especially if your subject is a mid-toned or darker subject, you’ll probably want to chose an exposure that just barely touches the left edge, and has no spike.
Using Your Histogram For Maximum Dynamic Range
So, what if your scene has too much contrast (dynamic range) and it bumps into both edges of the histogram? This is a situation that happens often in harsh or dramatic light, and your histogram can be the most helpful.
ETTR: Expose To The Right
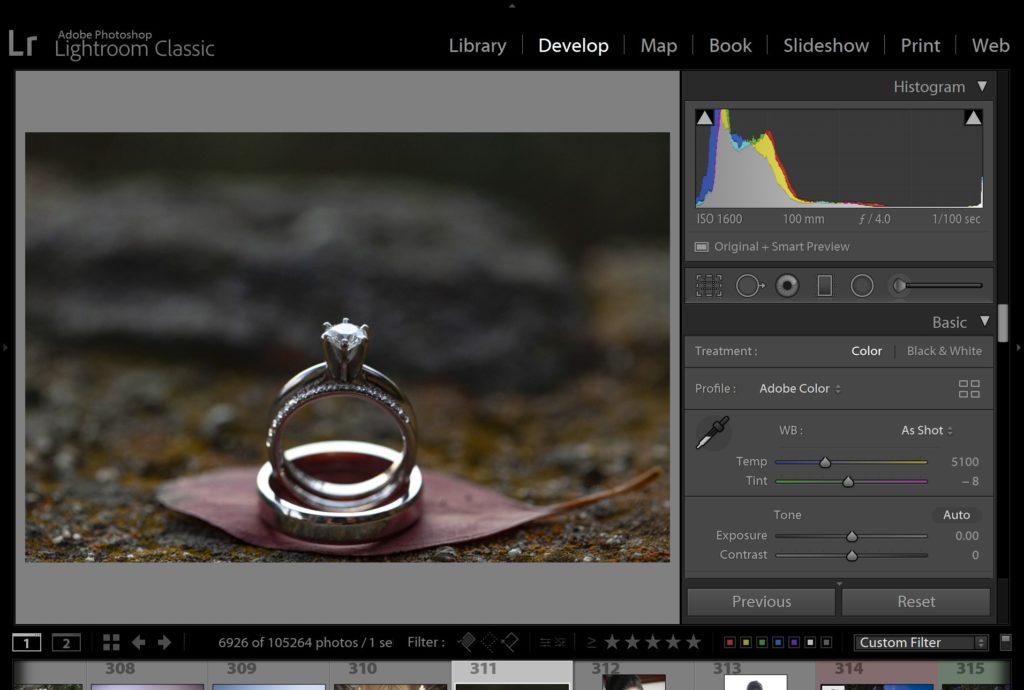
If you’ve heard about histograms at all before, then you’ve probably heard the phase, “expose to the right”, or ETTR. What does this mean? It refers to your histogram, and making sure that your highlights are perfectly exposed at the right edge of the graph.
In other words, ETTR is saying:
“ignore the shadows, choose your exposure by paying attention to the single brightest highlight in the scene; put that highlight precisely at the right-hand edge of the histogram, letting the rest of your image data fall wherever it may.”
This is a simple enough concept, and while it won’t always guarantee you that your darkest shadows will be saved, it will ensure that as much of your scene as possible is captured with the best overall image quality.
If your scene doesn’t have much contrast, and it easily fits within your histogram, can you just expose so that the image data falls ANYWHERE on the histogram graph? Actually, ETTR is still a good idea in these situations, because the left (shadow) half of your histogram does not have as good image quality as your right (highlight) half. In other words, if you severely under-expose your image, in-camera you will see a lot more noise in all of the tones when you brighten the image in Lightroom. So, ETTR when you want the least amount of noise in your image!
ETTL: Expose To The Left
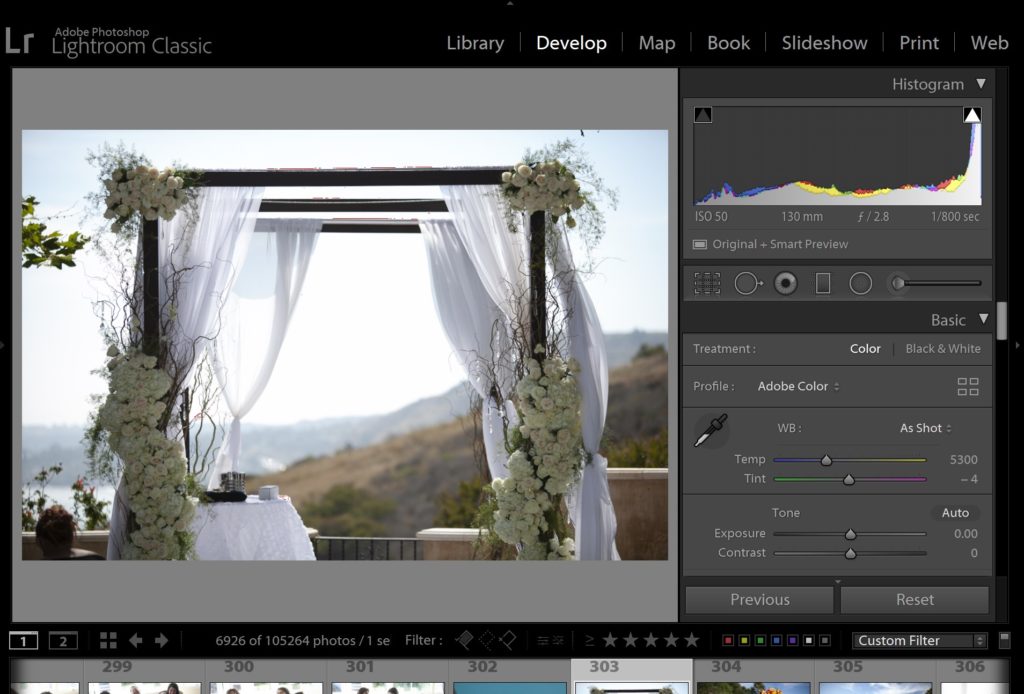
Oppositely, if you want to ensure good image quality for the shadows in your photo, but you don’t care if you lose the brightest highlights of a scene, then you’ll need to “ETTL”. “Expose To The Left” means, of course, that the left-hand edge of your histogram has become your main focus. Expose so that the darkest shadow in your image is just barely bumping into the left edge, and you have achieved ETTL.
A lot of people are confused by this, however, because often, to achieve ETTL, you have to “move” your histogram data even more towards the right, if there is a lot of contrast or dynamic range in the scene.
So, how do you tell ETTR and ETTL apart? Instead of thinking of it as “expose TO the…”, think of it as, “expose FOR the…” In other words, when you ETTR, you care about your highlights the most, and you expose to just barely preserve them. When you ETTL, you care about your shadows the most, and you expose to just barely preserve them. Either way, you are disregarding the other. Meaning, if you ETTR, your shadows may still be lost, or if you ETTL, your highlights may very well be clipped.
Why You Should Use ETTL For Certain Situations
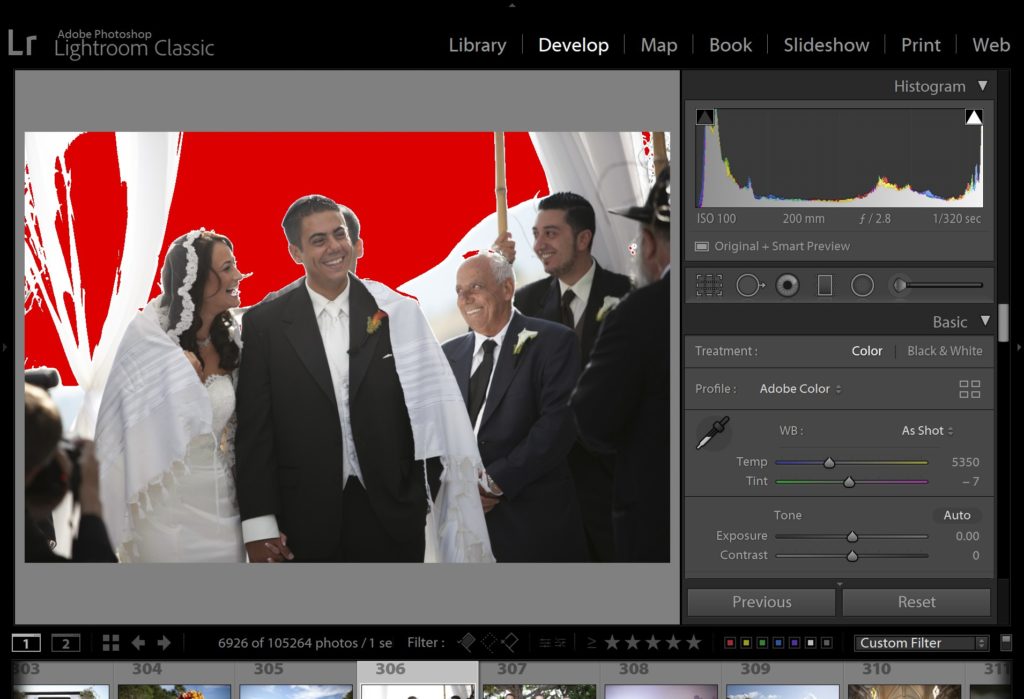
The big question is, why would you want to forsake your highlights, which aren’t recoverable? When you truly clip a highlight, it’s gone. But, when you severely under-expose a shadow, sometimes it can be recovered. This is why most people use ETTR, and not ETTL.
However, ETTL is a very useful technique in certain situations where your shadows and mid-tones are more important, and your brightest highlights are not. In portraiture, this actually happens a lot! Simply put, you shouldn’t base your entire exposure around a part of the image that is unimportant, and risk poor image quality (noisy details, un-saturated colors) on your important subject? Just use your histogram to correctly expose your subject, even if there are faces in shadow that require you to blow out a small part the background highlights.
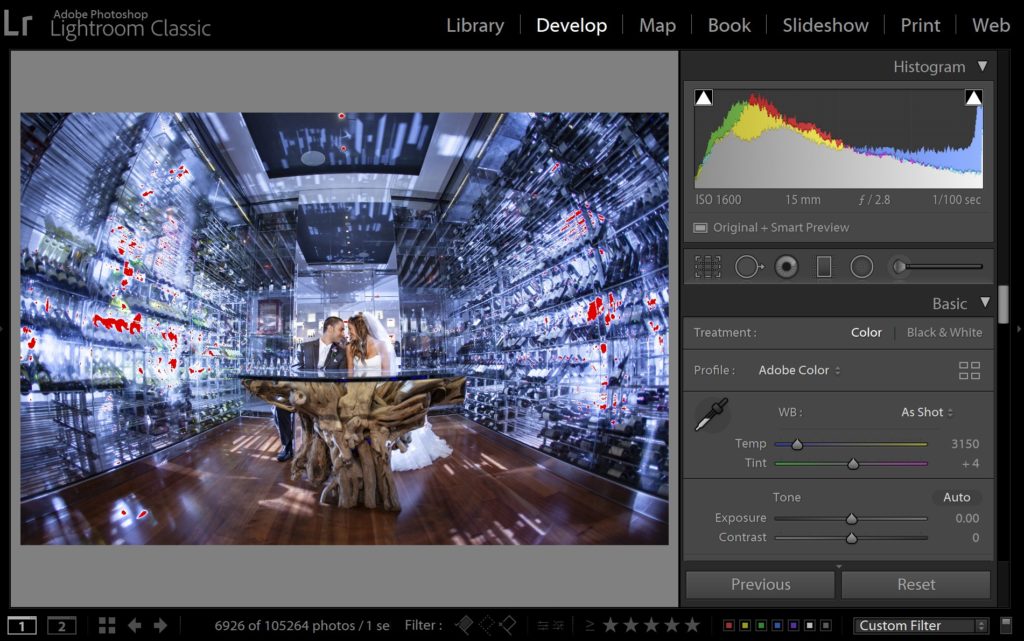
This will ensure that you always get images with good quality on the subjects themselves, and most of the time, any clipped highlights will be minor.
Using Your Histogram In Lightroom
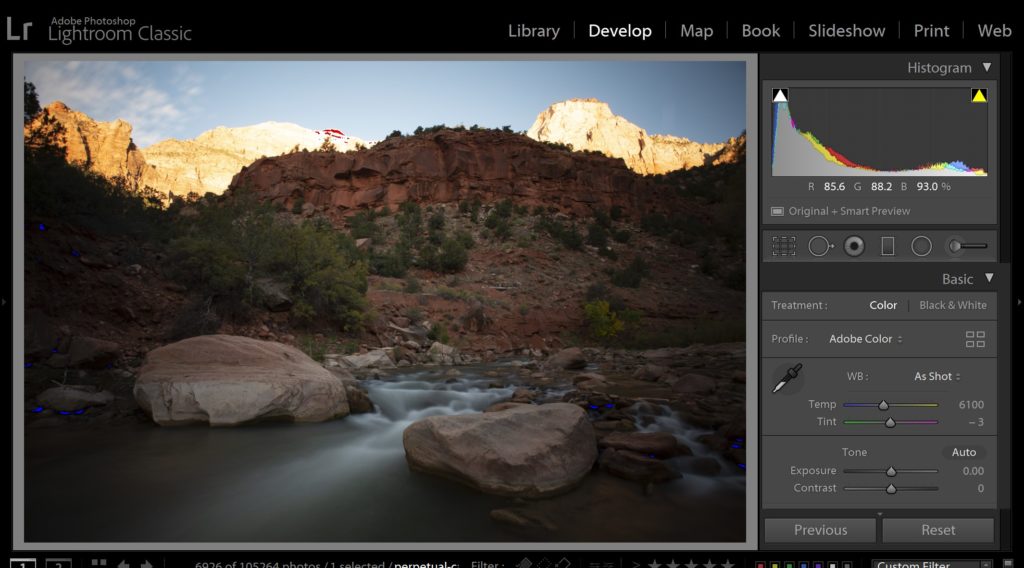
Okay, so, you’ve captured your images, and you got a histogram that looks good for your type of subject. Is that it? Actually, histograms can be helpful in post-production, too!
In Lightroom, your histogram can guide you in the right direction when editing your images. It appears in the upper-right corner of both the Library Module and the Develop Module, just click on the Histogram tab to show/hide it.
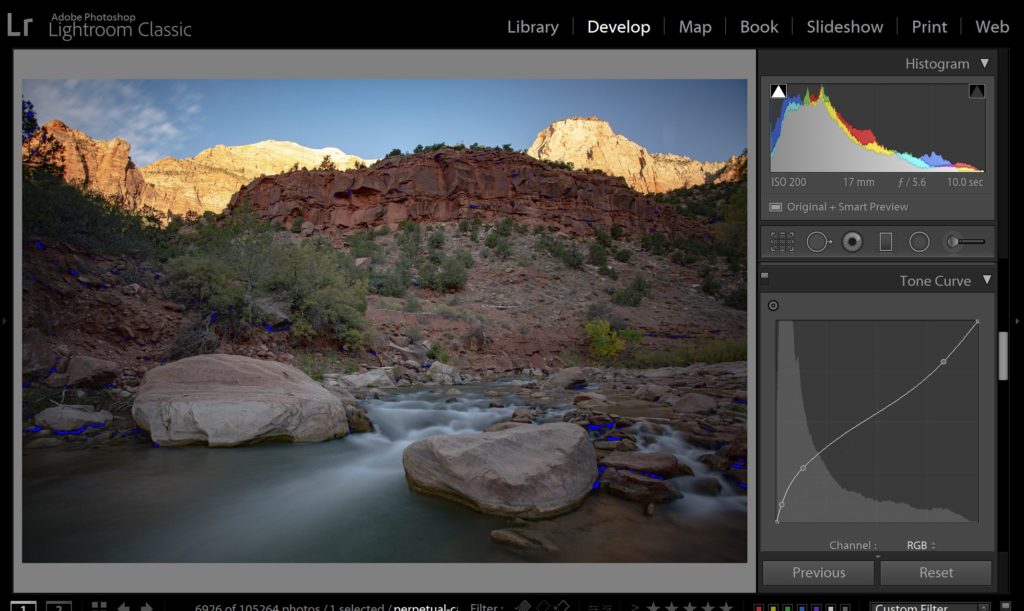
One of the best, most powerful ways to utilize your histogram is with the Tone Curve tab in the Develop Module. Lightroom overlays a histogram on your curve line, so you can adjust specific tones easily, and even use the “dropper” tool to pin-point multiple specific tones to adjust.
Conclusion
Now you know how to read and use your histogram. Whether your photography subjects are often landscapes and you religiously use ETTR, or you’re photographing portraits and action and similar subjects where you tend to lean a little more towards ETTL, the goal is to use your histogram to achieve exactly the results you want, and then process that raw image data in Lightroom to achieve the tones you want to see, too.
Learn More About Lightroom & Photography

For more education about Lightroom and photography, be sure to check out these full-length video workshops from SLR Lounge.
